Visualize Arduino Sensor Data Effortlessly
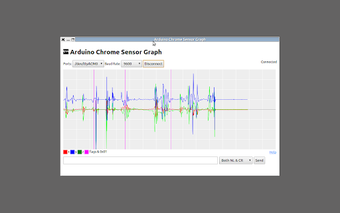
Arduino Chrome Sensor Graph is a free add-on designed for the Chrome browser that enables users to visualize sensor data from Arduino devices. This tool provides a straightforward interface for plotting real-time data, making it an essential tool for developers and hobbyists working with Arduino projects. With its user-friendly design, users can easily connect their Arduino sensors and observe data in graphical form, which aids in better analysis and understanding of sensor outputs.
The add-on supports various types of sensors and offers customizable graph options, allowing users to tailor the display to their specific needs. Whether for educational purposes, prototyping, or personal projects, Arduino Chrome Sensor Graph enhances the experience of working with sensor data, providing insights that would be difficult to glean from raw data alone. This tool is an excellent resource for anyone looking to integrate data visualization into their Arduino projects.